Measurement of impact on traffic mobility due to COVID 19 Lockdown


The Problem
The two most negatively affected industries due to the COVID19 Pandemic lockdown, were Travel & Tourism and Out of Home Advertisement. The OOH Industry suffered majorly as movement of people (User Mobility) on primary roads - most commonly used for Billboard Advertising - fell by drastic proportions (close to 100%). Even after the lockdown was lifted, a huge chunk of people preferred to stay at home and their mobility couldn’t move to pre-pandemic levels for quite some time.
After the lockdown was lifted, the OOH Advertising Industry which was barely recovering from the economic shock tried to understand the impact of COVID on various aspects of their businesses

The Approach
The AdMAVIN team (co-founded by IIT Madras Alumni) and Technology partner to some of the leading Outdoor Media agencies of India devised a
unique indigenous methodology to measure impact of COVID Lockdown on daily mobility, specifically the impression numbers on every road
segment. In simple terms,
if ‘X’ number of people were passing by the billboards, then what is the percentage change in
these numbers post relaxation of the Lockdown?
The AdMAVIN team developed an algorithm and launched a unique “COVID Impact Tool” for its agency partners to measure the change in impression numbers or mobility due to the Lockdown. This was well publicized by some of our partners in the media. (reference: https://www.afaqs.com/news/advertising/madison-ooh- updates-traffic-count-tool-for-covid19-unlock).
AdMAVIN has garnered a strong reputation for building indigenous methodologies and algorithms which are based on reliable and accurate data sources. In this case, the COVID Impact Tool relied primarily on the Google Mobility Report as explained below.
Google Mobility Report presented mobility trends in several categories. Such trends are analyzed on a monthly basis as shown in the image.
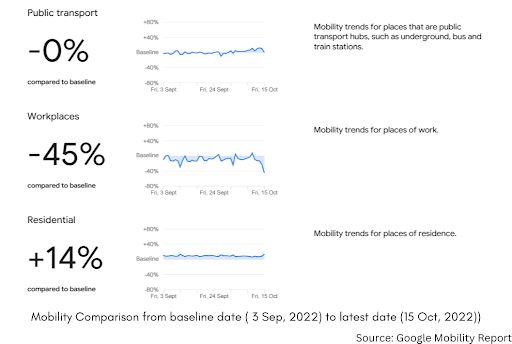
Here Google suggests changes in footfall of several cumulative Points of Interests(POI) categories for example, Public transport, Workplace and Residential places among many others.
It doesn’t directly solve the problem of the OOH industry. Industry wanted to know more about change in mobility which pertains to routes taken by users as most of the billboards, unipoles, bus shelters etc. are placed along the routes. Moreover Google Mobility report didn’t Change in Mobility over a given POI and was cumulative. For example, if one wanted to know the impact on mobility on AdMAVIN Office in IIT Madras, Google Mobility won’t address it. It will tell the impact of Covid on mobility across all the offices in Chennai. So the OOH Agencies were still looking desperately for a solution to meet their requirements, i.e. Measurement of Impact localized or scaled down to a media site or Road segment level.

The Solution
Formulation of methodology using Google Mobility Report
Mobility information of the user is directly related to POI data. If someone travels from a residential society to a nearby school to drop off his/her ward, we can very well understand the route that he/she must have taken for the trip. Thus POI data can also give us route data.
Any change in footfall of POI can very much be related to footfall of the audience on roads and thus also tells us about change in impression numbers for OOH Advertisements. Let’s build on this useful understanding!
A perimeter of radius 1000 meters around the road’s coordinate is used to understand the locality by analyzing the Points of Interest (POI) present in it.
AdMAVIN used the following classifications of POI-:
- Sustenance/Eateries
- Education
- Transportation
- Entertainment
- Residential
- Commercial
- Industrial
These POI Classifications are mapped with Google's place categories (from the Mobility Report), to map the classification wise change in percentage. As a given location contains various kinds of POIs, we can estimate the change in percentage by calculating the weighted average of the change percentage of these respective categories. An example calculation is provided in the example section.
Key Notes / Observations:
- The change percentages of Google Report are not Traffic Change percentages. They are the avg. change in people observed in a given Point of Interest.
- Even though the residential areas have a +ve change in mobility, the overall traffic change can still be -ve in residential areas due the drop in the other Points of Interest (shops, restaurants, etc.) in that locality.
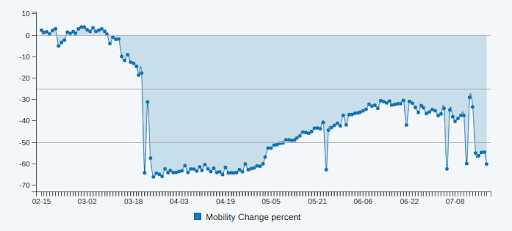
- As the Google report provides the day-wise change percentages since Feb 15th 2020, the OTS can also be measured day wise from Feb 15th till date. The Image below shows the day-wise change percentage of mobility.
- Google mobility reports are released with a delay of 4 days to one week. Hence the OTS can be measured for any day up until a week before from any given day.
Example OTS Calculation for COVID19 times:
Location: Wadern Road St.Stephen Church, South Mumbai
Lat, Long: 18.964521, 72.804455
Media is assumed to be - “LIT”
For this Locality, the change percentages as per Google Mobility Report on - 14th June
- Grocery & pharmacy : -25.0%
- Retail & recreation : - 72.0%
- Parks : - 70.0%
- Transit stations : - 52.0%
- Residential : 16.0%
- Workplaces : -24.0%
MAVIN POI distribution (share of various POIs) within changes to MAVIN 1000mts radius for this Locality
- Commercial : 9.0%
- Education : 1.0%
- Residential : 15.0%
- Sustenance : 65.0%
- Transportation : 8.0%
Post the Mapping of mobility classification, the traffic change_percent calculated using the Weighted Average method : -52.19 %
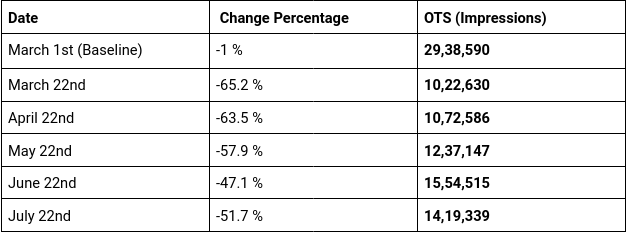
As the OTS changes daily and can be estimated for any date between Mar 15th till date, find below the OTS data for several dates..